
Latest WGU Applied-Algebra C957 Practice Questions By Ward
Question 1
The graphed function represents the number of animals, , at a feeding station hours after 5:00 a.m. The plotted points and have coordinates and .
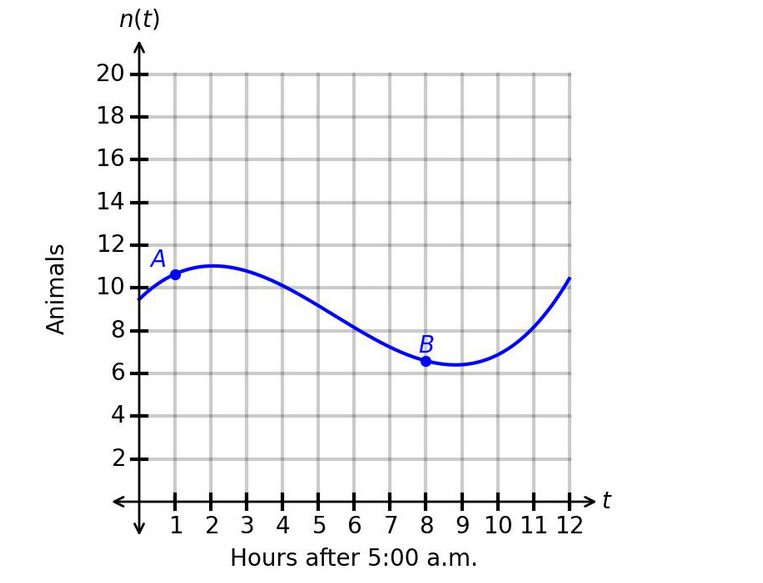
Which statement gives the correct interpretation of the average rate of change of the number of animals over the interval from point to point ?
Question 2
The number of comments on a social media post is represented by the logistic function , whose graph is shown, where represents the number of days since the post was created and represents the number of comments on day .
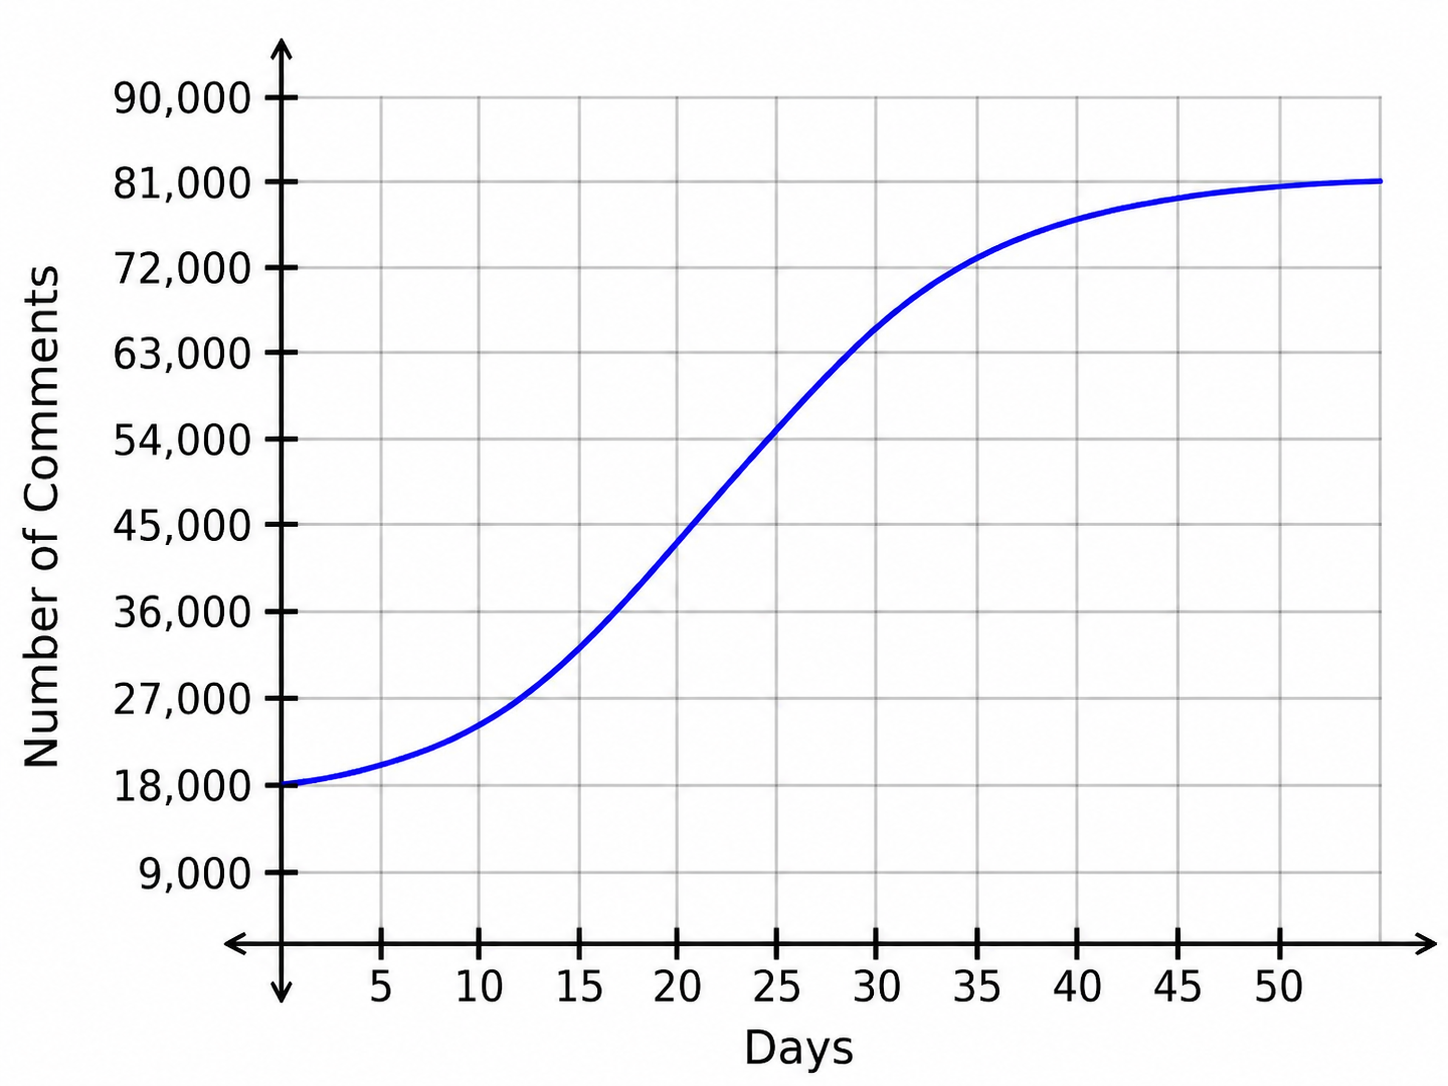
How does the number of comments change as time progresses from day 1 to day 17?